To value an MSP, you run four steps in order: normalize earnings so the profit number is real, pick a multiple band that matches your size, adjust that multiple up or down for the four things buyers actually diligence, then apply the band to the normalized number as a range, not a point. That is the whole method, and you can run it yourself before any advisor sends you a teaser. The order matters. Most owners jump straight to "what multiple will I get" and skip the step that decides everything, which is getting to a profit figure a buyer will accept once their accountants have picked it apart.
I spent a decade in investment banking and private equity working on transactions north of $7bn, and I now run growth inside managed services and B2B service businesses. The gap between what an owner thinks their business is worth and what a buyer's quality-of-earnings review concludes is almost always the same gap: the profit was never normalized, and the multiple was borrowed from a headline that did not apply. This guide closes both. For the multiple bands themselves, the full evidence sits in the MSP valuation multiples breakdown. Here we turn those bands into a method.
Step 1: Normalize earnings before you touch a multiple
A multiple applied to a fake profit number gives you a fake valuation. This is the single most common mistake owners make, and experienced buyers catch it in the first meeting. Before you multiply anything, you have to agree what the "E" in the multiple actually is.
Which earnings figure you use depends on size. For an owner-run shop where the founder is still the main operator, buyers work off SDE (seller's discretionary earnings): net profit plus the owner's salary, perks, and one-off costs added back, because a new owner would either replace the founder or absorb that role. Once a business is large enough to run without the founder driving delivery, and generally once normalized profit clears roughly $1M, buyers switch to EBITDA with a full management team already costed in. The line is not exact, but the principle is: SDE assumes the owner leaves and is not replaced by a salaried manager; EBITDA assumes the business already pays for its own management.
The owner-salary add-back trap
Here is the pattern practitioners on forums like r/msp call out constantly, and it is worth walking the math because it kills more deals than any other single issue. An owner advertises a business doing $350k in revenue with "$200k of EBITDA" and prices it at a multiple off that number. The problem is that the owner pays himself little or nothing and is doing the work of a general manager, a lead engineer, and the head of sales all at once.
Charge a real market salary for the roles that owner is filling, say $130k to replace a working general manager, and the picture collapses:
| Line | Reported | After normalizing |
|---|---|---|
| Revenue | $350,000 | $350,000 |
| "EBITDA" as advertised | $200,000 | $200,000 |
| Market-rate salary for owner's actual roles | $0 | -$130,000 |
| Normalized EBITDA a buyer will underwrite | $200,000 | $70,000 |
The advertised number and the underwritable number are not close. A buyer is not buying a $200k-profit business at a 4x multiple for $800k. They are buying a $70k-profit business, and once you factor in that the entire book of business is really the owner's personal relationships, they may value it closer to 1x that normalized figure. The takeaway is blunt: if you have not charged yourself a market salary, your EBITDA is a marketing number, not a valuation input. Fix that first. The rest of this method is worthless applied to an inflated base.
Step 2: Pick your band from the multiple ladder
Once you have a normalized profit figure, you pick the multiple band that matches your size. The bands below are the published like-for-like ranges, reconciled across US brokers and UK practitioners rather than lifted from any single "8-10x for everyone" headline. That headline is the exact chatter the practitioner community mocks, and UK specialists like Daniel Welling of the MSP Finance Team openly dismiss it for small MSPs.
| Size band (normalized profit) | US EV/EBITDA | UK EV/EBITDA |
|---|---|---|
| Owner-run / sub-$1M EBITDA | 3-6x (broker quotes 2-5x; IBBA Main St 2.86x SDE) | 3-5x |
| $1-5M EBITDA lower-mid | 5-10x | 5-8x |
| Platform / $5M+ EBITDA | 10-15x | 8-13x |
Two things about this ladder that most owners get wrong. First, the US prices at or slightly above the UK at every size. The internet is full of charts showing the UK richer, but that is a disclosure artifact: UK deals file at Companies House and become computable, while US private deals stay dark unless a listed acquirer discloses. Do not plan around a UK premium that is not real. The full reconciliation and the chart sit in the valuation multiples piece.
Second, size is close to destiny for the multiple, and the jumps are not smooth. The band you land in is set by your normalized profit, and moving from the top of one band to the bottom of the next often does more for your proceeds than a full extra turn inside your current band. This is why the size question comes before the adjustment question.
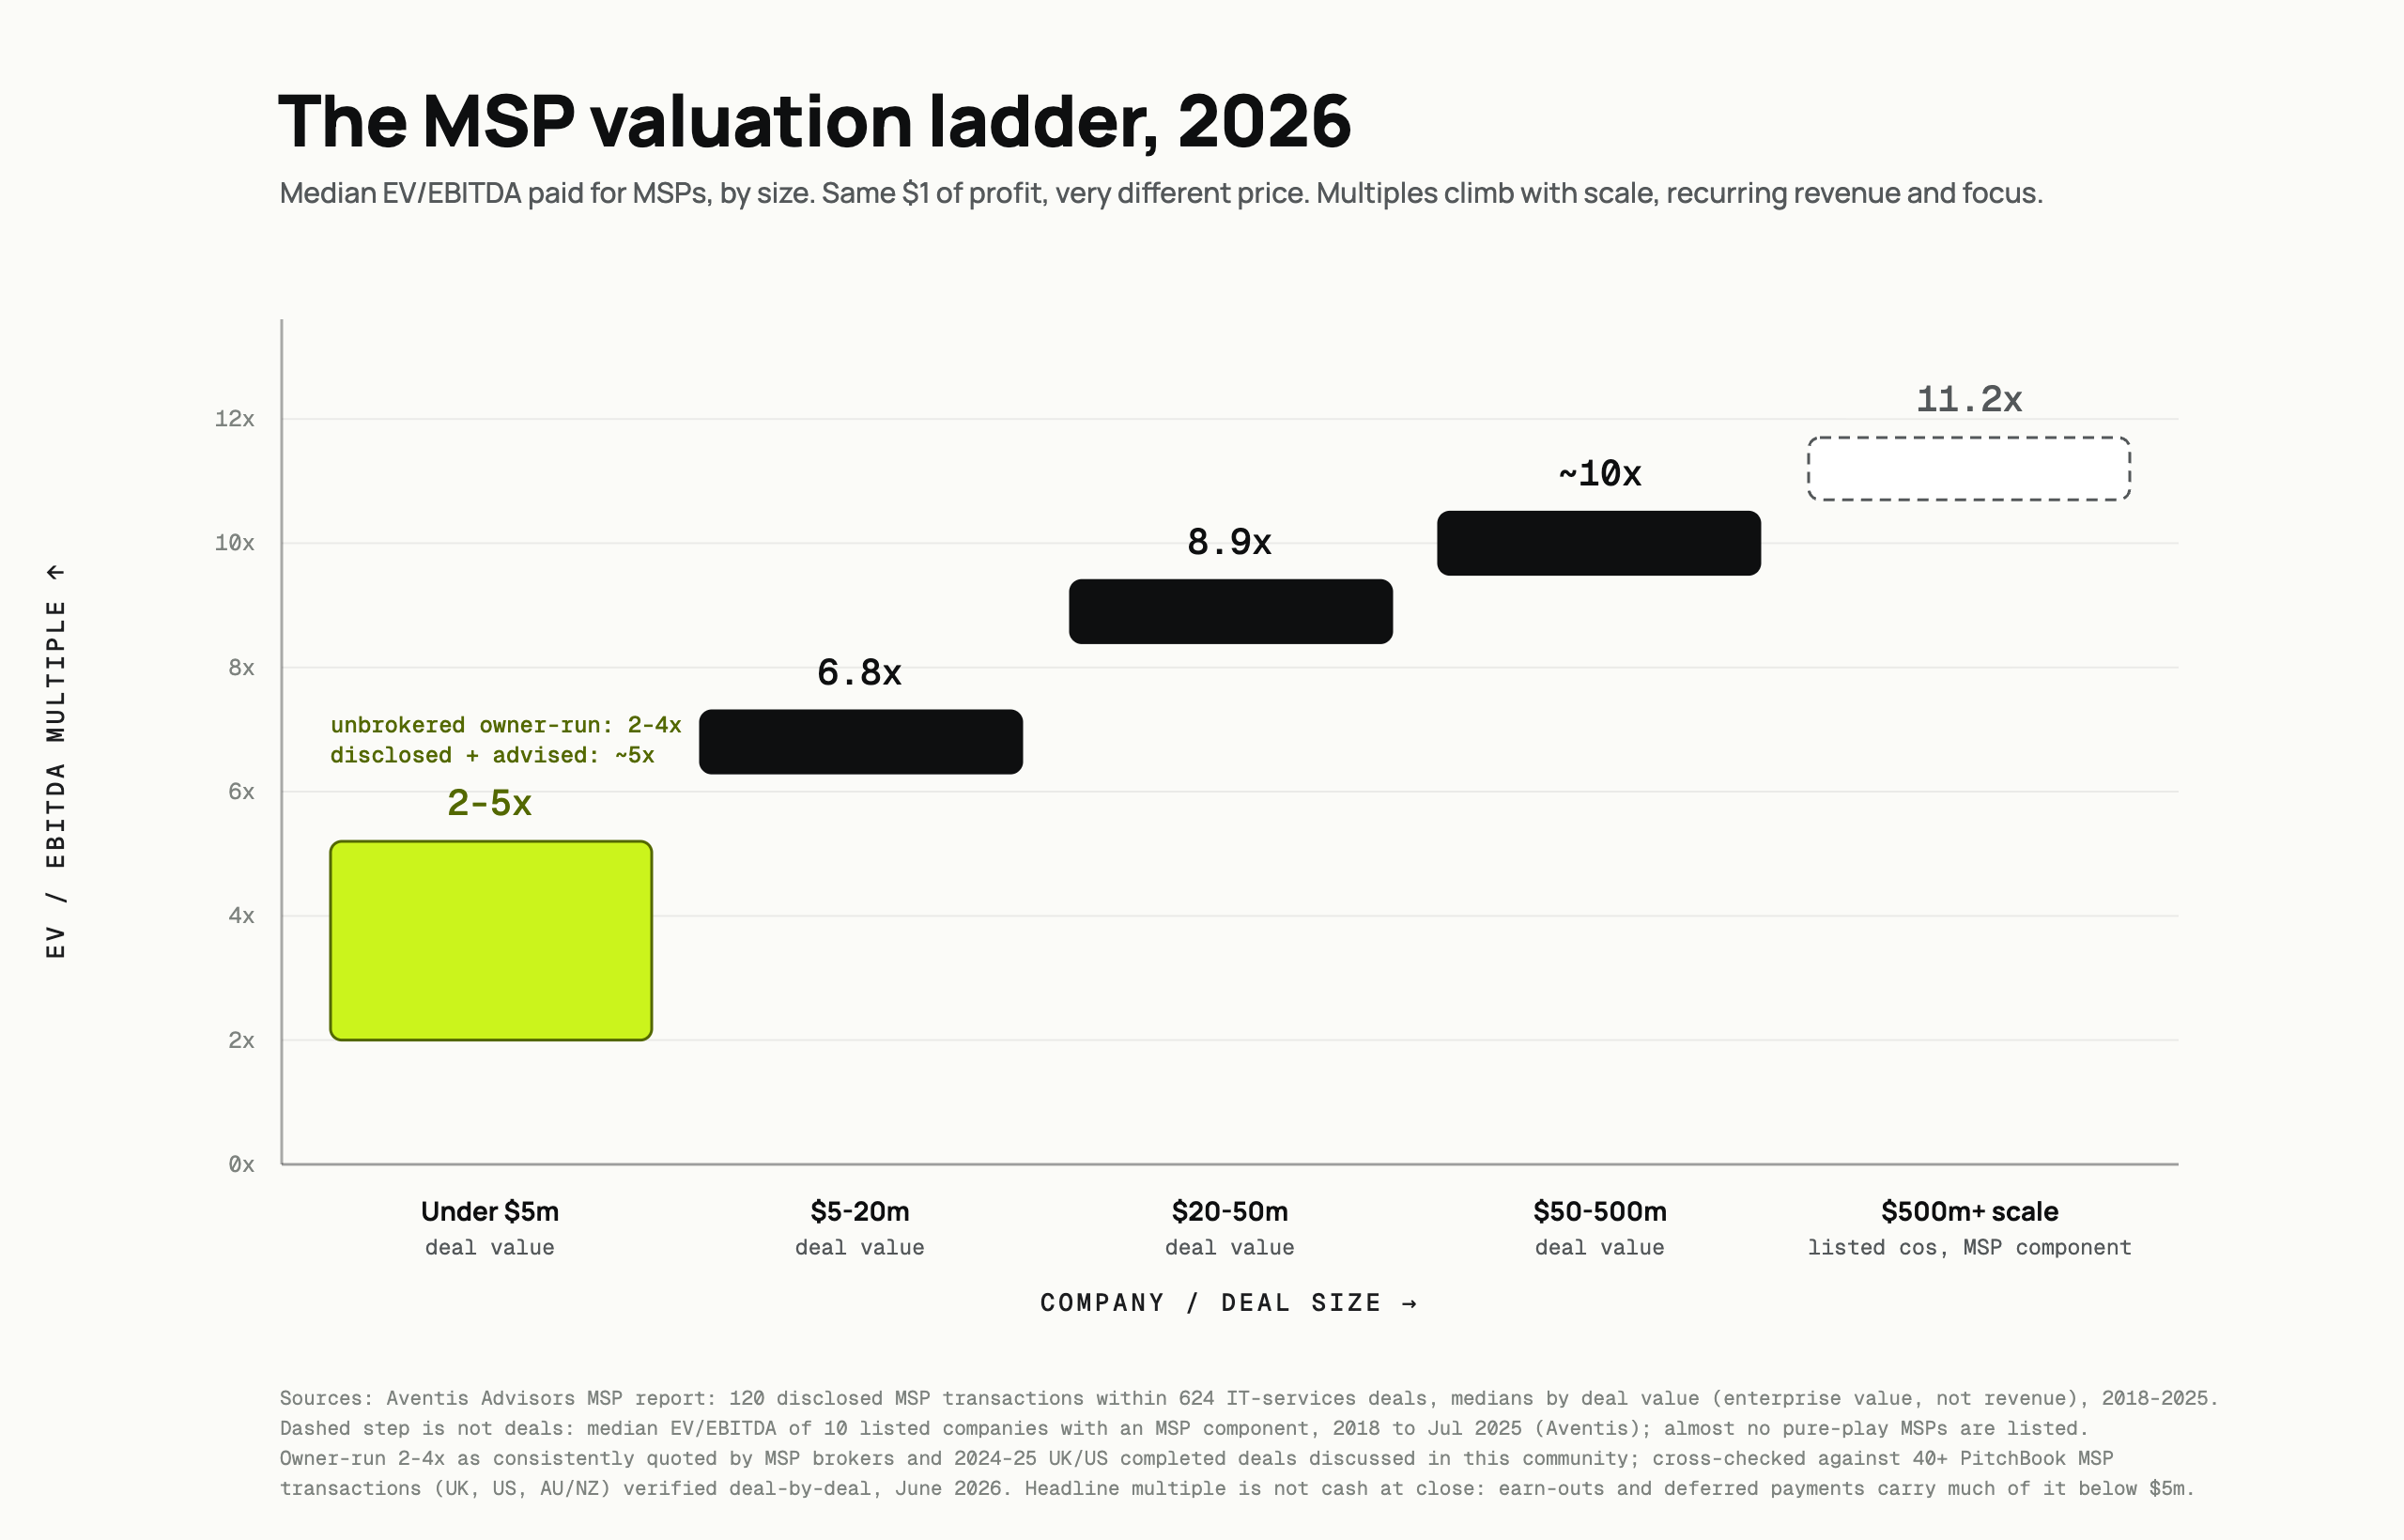
The ladder chart above cuts the market a different way, by deal value rather than by EBITDA band. Under $5m of deal value, disclosed multiples run 2-5x, and unbrokered owner-to-owner sales sit at the bottom of that (2-4x), with earn-outs and deferred payments carrying much of the headline. From there it climbs: $5-20m deals around 6.8x, $20-50m around 8.9x, $50-500m near 10x. Keep the two cuts separate in your head. One is by your profit size, the other is by the size of the whole transaction. Both are real, and conflating them is how owners talk themselves into the wrong number.
Step 3: Apply the four adjustments buyers actually make
The band gives you a starting multiple. Where you land inside it, or whether you slip below it, comes down to four risk factors buyers diligence every time. These are the levers that move you within your band. None of them will jump you a whole band on their own, but together they decide whether you get the top or the bottom of your range.
MRR quality and recurring mix
Not all revenue is equal, and buyers price the durable part far higher than the rest. Contracted monthly recurring revenue from managed-services agreements is the asset. Break-fix work, one-off projects, and hardware resale get much less credit because they do not repeat. A useful rule of thumb from the buyer side is that around 60% recurring revenue is where a business starts reading as attractive; below that, you carry a discount. Sell the recurring base as the core of the business, and be honest with yourself about how much of your top line is really project and product revenue dressed up as recurring.
Contract terms, and the debate underneath them
The obvious view is that month-to-month contracts cap your multiple and multi-year signed agreements lift it. That is directionally true, and forum practitioners will tell you M2M books with no documented processes get discounted hard. But there is a genuine practitioner debate worth knowing before you panic about your paper.
Amy Babinchak and Ryanne Bushey of sell my MSP argue that a rolling one-year contract that keeps renewing is worth roughly as much as a five-to-seven-year unwritten relationship, because what buyers are really pricing is tenure and stickiness, not the contract term on paper. The hard-line opposite comes from Adam Borst of Vista Business Group, who has said on the All Things MSP podcast that a client with no signed contract at all is worth close to zero to him as a buyer, because nothing obligates that client to stay through a transition. Both are attributed practitioner views, not verified data. The practical read: signed multi-year paper is safest, a long renewing relationship is defensible, and no contract at all is the version that genuinely zeroes out.
Client concentration
If one client is a large share of your revenue, a buyer prices the risk that losing them craters the business the week after close. Heavy concentration, one client above half your revenue is the classic red flag, pushes buyers toward earn-out structures that put your proceeds at risk rather than a clean price. Spreading revenue across more accounts before you go to market is one of the few adjustments that is fully in your control and directly protects your cash at close.
Owner dependence
This is the one owners underrate most. If the business cannot run without you, a buyer is buying a job, not a company, and they discount accordingly. The test buyers apply is simple: could the owner disappear for 30 days and the work still get done. If the answer is no, that is a discount you built yourself. The good news is it is fixable, but only with time. Delegating delivery, then account management, then finally sales, is a multi-year project, which is the whole argument for starting exit prep years before a process. That sequencing is the core of the exit-readiness work, and the levers that structurally move your multiple are laid out in the valuation drivers piece.
Step 4: Know which EBITDA the buyer will price
You can normalize your earnings honestly and still get repriced at the finish line, because you and the buyer may be defining EBITDA differently. This is where deals fall apart between the signed letter of intent and the close, and it is worth understanding before you celebrate a headline number.
The distinction that triggers most repricing is run-rate versus trailing-twelve-months EBITDA. Trailing-twelve-months (TTM) is your actual profit over the last full year. Run-rate takes a recent short window, often the latest three months annualized (last quarter times four), and treats that as your ongoing profit. When the market is running hot for you, run-rate flatters the number. When you have a soft quarter, run-rate is a weapon in the buyer's hands.
Abraham Garver, who leads the MSP practice at FOCUS Investment Banking, has said on the Business of Tech that across the platforms and parties his firm has advised, roughly six out of ten deals get repriced (retraded) between the letter of intent and close, and closer to nine or ten out of ten for sellers going through it without an advisor who sees it coming. His named triggers, all practitioner-reported: a buyer's quality-of-earnings review that insists on run-rate EBITDA instead of TTM and then catches a weak quarter; clients lost between signing and close (his example: losing two or three clients worth about $200k of recurring revenue triggered a $2M valuation haircut); or simply missing a forecast the seller themselves put forward. Garver also cites an informal market norm that buyers historically agreed not to retrade unless value moved more than about 7%, with advisors now holding the line nearer a 10% swing.
The lesson for your own valuation: model both. Run your number on TTM, then run it again on your last quarter annualized. If those two figures are far apart, you have a repricing risk baked in, and you either wait for a stronger stretch of quarters or you go in with your eyes open about which definition the buyer will push.
A worked example: a $3M revenue MSP
Put the four steps together on a realistic business. The cost lines below are illustrative, chosen to show the method, not benchmarks. Only the multiple bands come from the canon.
Start with a $3M-revenue MSP. The owner still runs sales and sits in on delivery escalations, and pays himself a below-market $90k. Here is the normalization:
| Line (illustrative figures) | Amount |
|---|---|
| Revenue | $3,000,000 |
| Recurring managed-services revenue (72% of top line) | $2,160,000 |
| Reported net profit | $360,000 |
| Add back: owner salary paid | +$90,000 |
| Less: market salary to replace the owner's roles | -$150,000 |
| Add back: one-off legal and rebrand costs | +$40,000 |
| Normalized EBITDA | $340,000 |
Normalized EBITDA lands at $340,000, comfortably in the owner-run, sub-$1M band. From the canon ladder, that band is 3-6x in the US. Now apply the four adjustments to decide where inside the band this business sits:
- MRR quality: 72% recurring is above the ~60% "attractive" line. A point in favour, pushes toward the middle-to-upper part of the band.
- Contract terms: assume a mix of one-year renewing agreements, defensible but not multi-year signed paper. Neutral to slightly positive.
- Client concentration: assume the top client is 18% of revenue, no single dangerous account. Neutral, no earn-out pressure from concentration.
- Owner dependence: the owner still owns sales and touches delivery. This is the drag. It pulls the multiple down and is the main reason this business does not command the top of its band.
Net it out and this looks like a low-to-mid-band business: call it 3.5x to 4.5x on normalized EBITDA. That gives a range, not a point:
| Scenario | Normalized EBITDA | Multiple | Indicative enterprise value |
|---|---|---|---|
| Conservative | $340,000 | 3.5x | $1,190,000 |
| Upper end of profile | $340,000 | 4.5x | $1,530,000 |
So the honest answer for this business is roughly $1.2M to $1.5M of enterprise value, before deal structure. Note two things. The owner who advertised "$360k of profit at 5x, so $1.8M" was wrong on both inputs: the profit was not normalized and the multiple ignored his owner dependence. And the single highest-leverage move here is not squeezing the multiple, it is spending eighteen months getting himself out of sales and delivery so the business reads as less owner-dependent, which is exactly the groundwork the drivers and exit-readiness pieces cover. For who ends up paying at the top versus the bottom of these bands, see who buys MSPs. The books that teach an owner to get out of sales and delivery in the first place are in the best books for MSP owners.
Frequently Asked Questions
Use SDE (seller's discretionary earnings) for an owner-run shop where the founder is still the main operator, because a buyer either replaces or absorbs that role. Switch to EBITDA once the business runs without the founder and normalized profit clears roughly $1M, since at that size the buyer expects a full management team already costed into the numbers.
Almost always because you did not charge a market salary for the roles you personally fill. If you run sales, delivery, and management while paying yourself little, your reported EBITDA is inflated by the salary you skipped. Buyers back that salary out, which can turn an advertised $200k of EBITDA into $70k of underwritable profit and reprice the whole deal.
An owner-run MSP below $1M of normalized EBITDA typically sells at 3-6x in the US (broker quotes often 2-5x) and 3-5x in the UK. The "8-10x for everyone" figure you see online does not apply at this size, and unbrokered owner-to-owner sales sit at the bottom of the range with earn-outs carrying part of the headline.
Run-rate EBITDA annualizes a recent short window, often the last quarter times four, instead of using your full trailing-twelve-months profit. It matters because buyers frequently switch to run-rate during quality-of-earnings review, and a single soft quarter can then tank the number and trigger a lower price at close. Model both figures before you go to market so any gap does not surprise you.
They can, but tenure often matters as much as the paper. Some practitioners argue a one-year contract that keeps renewing is worth roughly as much as a long unwritten relationship, because buyers price stickiness, not just contract length. The version that genuinely destroys value is having no signed contract at all, since nothing obligates a client to stay through a transition.