Most MSPs sell for 3 to 6 times EBITDA if they are owner-run and under about $1M of EBITDA, 5 to 10 times once they reach $1M to $5M of EBITDA, and 10 to 15 times if they cross $5M of EBITDA and read as a platform rather than a job. That is the honest range for a US MSP in 2026, and the UK sits a touch below it, not above. Everything else you read online is a variation on those bands, dressed up with different confidence and different sourcing. This page shows you the ladder both ways buyers actually use it, explains why every published number you find disagrees with the next one, and gives you the full source table the advisor blogs leave out.
I spent a decade in investment banking and private equity working on transactions north of $7bn in aggregate, including a board seat through a $300m+ PE exit. Today I run growth inside a US managed services business. So I am reading these multiples from two seats at once: the finance seat that priced deals, and the operator seat that has to live inside one. I am not selling you a valuation, a broker retainer, or a "book a call" funnel. The numbers below are traceable, attributed, and where the data is thin I say so.
The size ladder, both ways buyers use it
There is no single MSP multiple. There is a ladder, and the rung you sit on is set mostly by size, quality and which PE platform is on the other side of the table. The confusion in most published content comes from mixing up two different cuts of that ladder: one sorted by EBITDA band, one sorted by deal value. They are not the same axis, and conflating them is how people end up quoting a platform number to an owner running a $400k-profit shop.
Cut one: by EBITDA band
This is the cut an owner should start with, because you know your own EBITDA. Reconciled across published US and UK sources, the like-for-like bands look like this.
| Size band | US EV/EBITDA | UK EV/EBITDA |
|---|---|---|
| Owner-run / sub-$1M EBITDA | 3 to 6x (broker quotes 2 to 5x; IBBA Main Street 2.86x SDE) | 3 to 5x |
| $1M to $5M EBITDA, lower mid-market | 5 to 10x | 5 to 8x |
| Platform / $5M+ EBITDA | 10 to 15x | 8 to 13x |
Two things to notice. First, the US prices at or slightly above the UK at every rung, which is the opposite of what a lot of people assume. More on why in the next section. Second, the jump between rungs is steep. Crossing from a $900k-EBITDA business to a $1.2M one is not a 30% change in value; it can move you a full turn or two up the multiple as well, because you cross the threshold where a different, deeper-pocketed set of buyers starts paying attention.
Cut two: by deal value
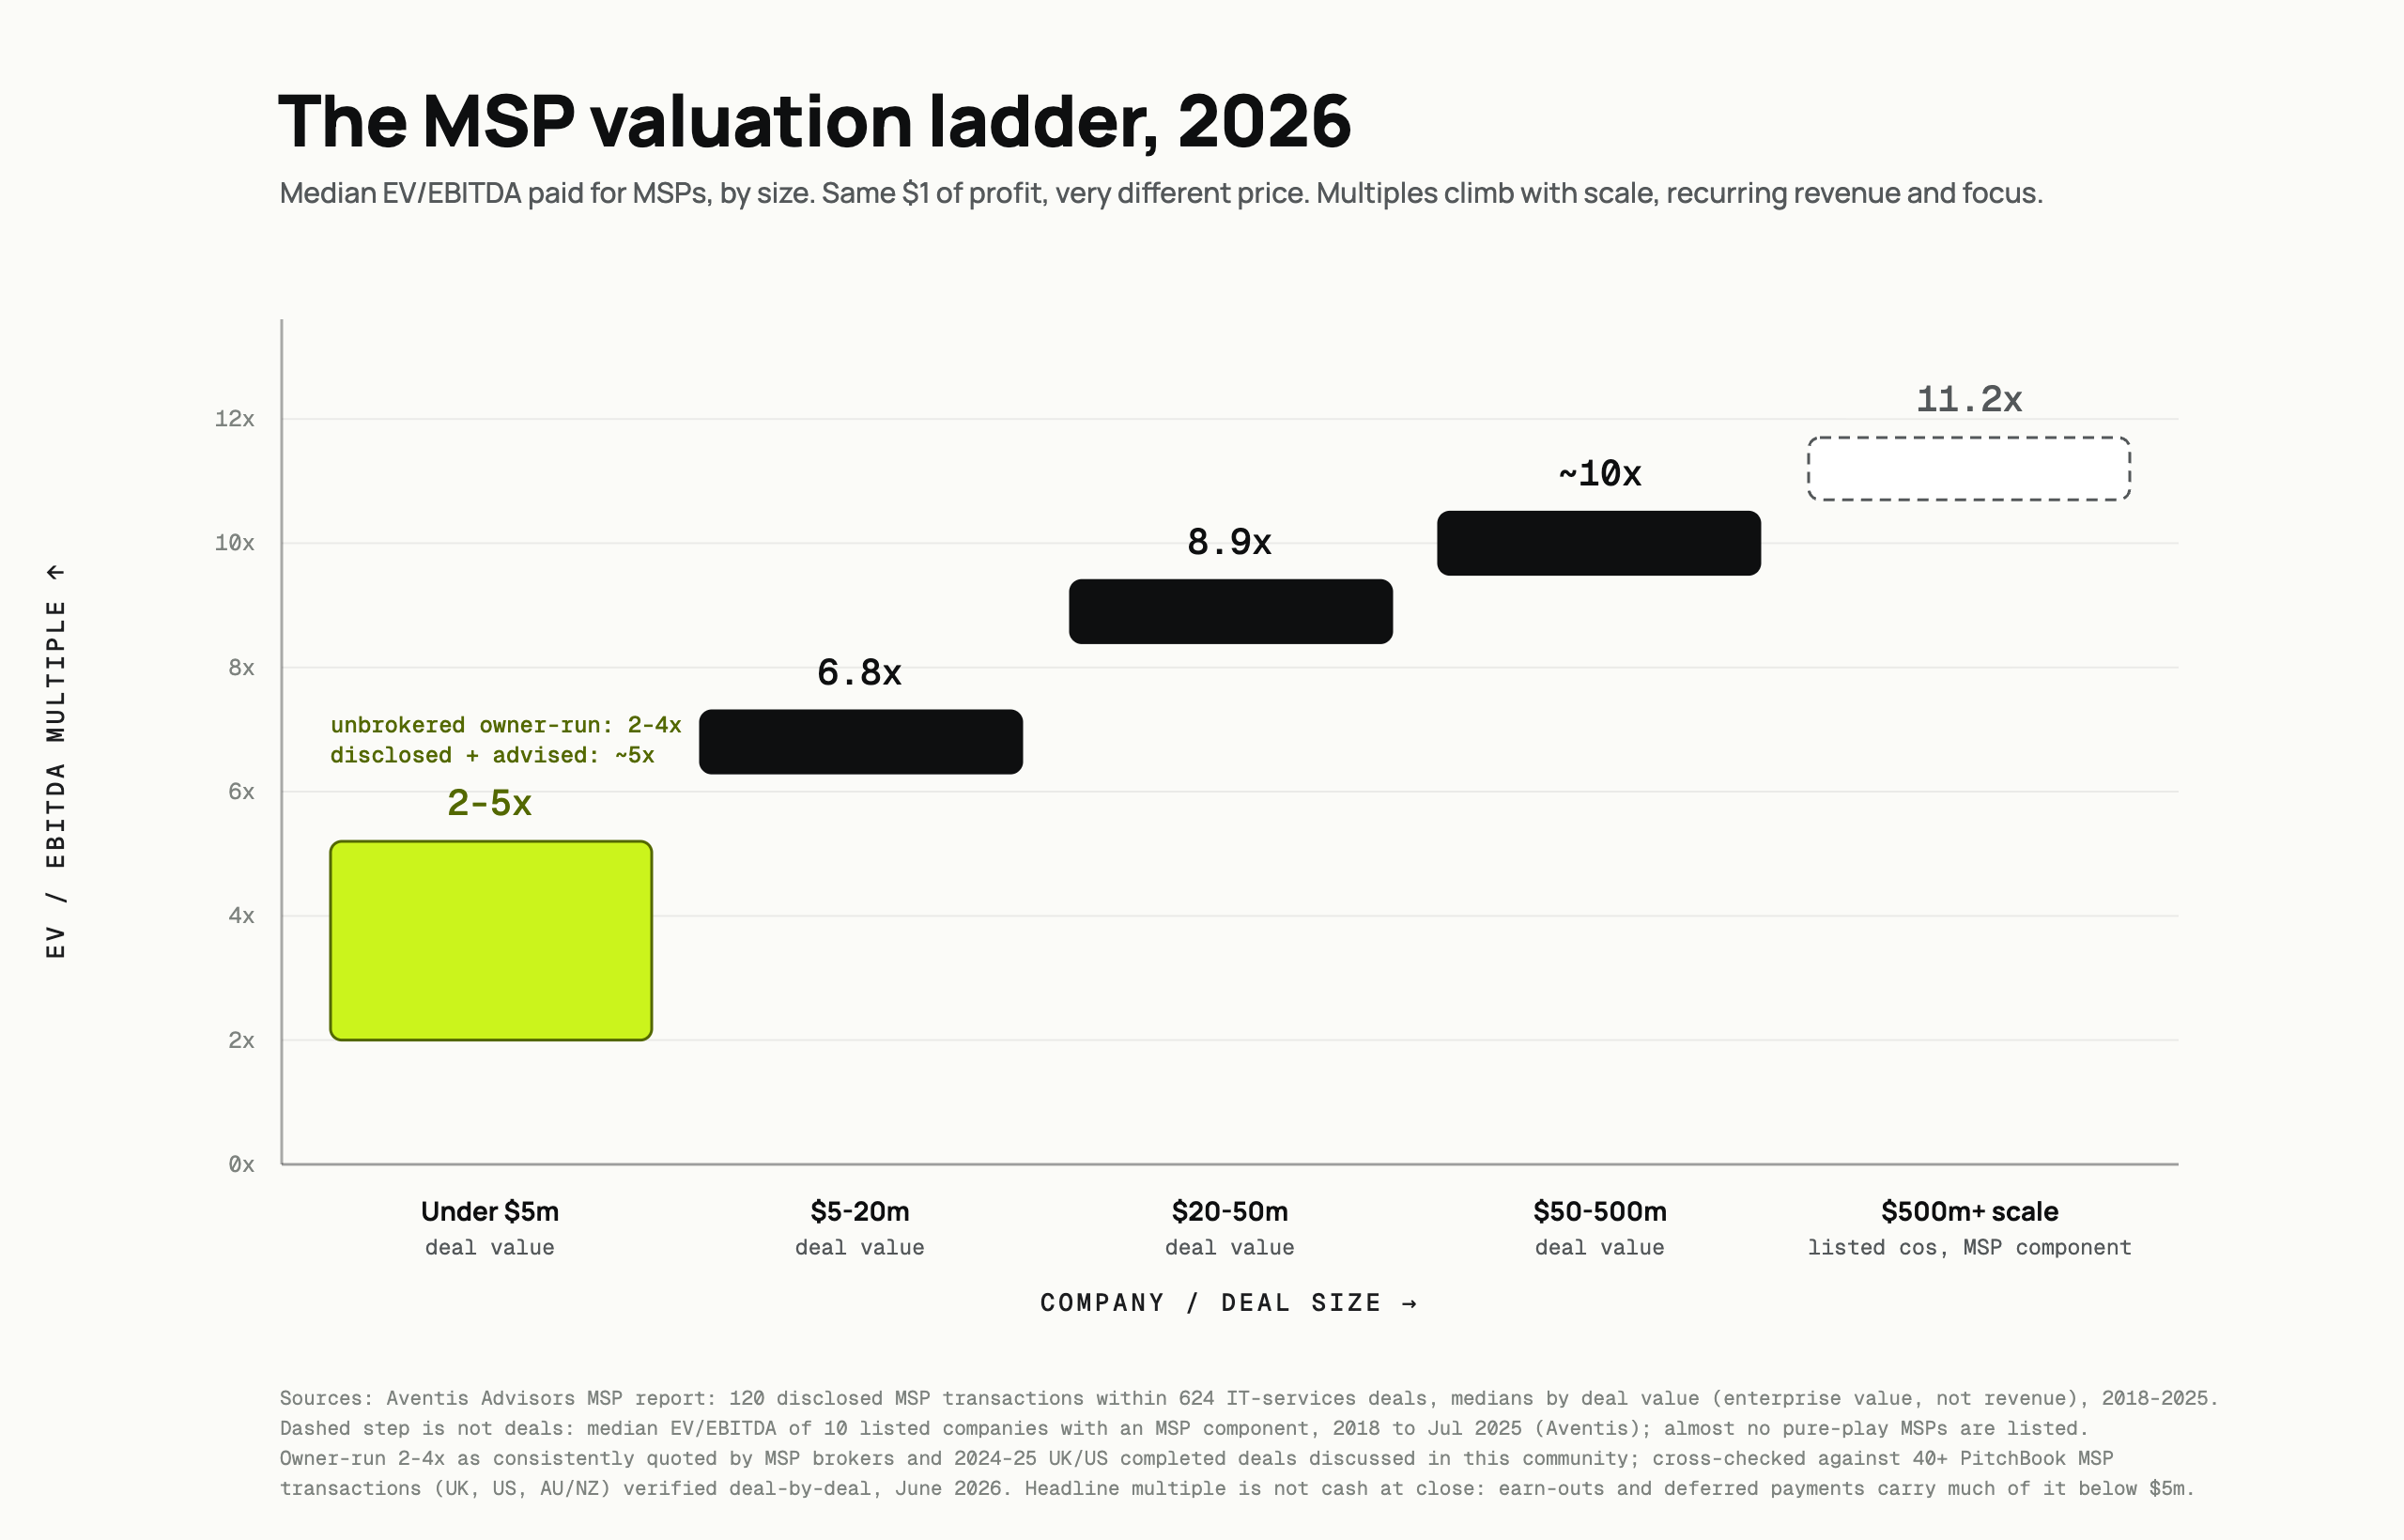
The chart above uses the other cut: deal value, not EBITDA band. It comes from Aventis Advisors, who looked at 120 disclosed MSP deals sitting inside a wider set of 624 IT-services transactions from 2018 to 2025. Sorted by the size of the deal:
| Deal value | Median EV/EBITDA |
|---|---|
| Under $5m | 2 to 5x (unbrokered owner-to-owner 2 to 4x; disclosed and advised nearer 5x) |
| $5m to $20m | 6.8x |
| $20m to $50m | 8.9x |
| $50m to $500m | around 10x |
| Listed companies with an MSP component | 11.2x (these are public-company reads, not deals) |
Keep the two cuts straight. The EBITDA table is what you should map yourself against as an owner. The deal-value ladder is what shows up in most transaction datasets, because deals get reported by their headline value, not by the target's EBITDA band. Both are real. Quoting one as if it were the other is the single most common error in this category of content.
One honest caveat before you anchor on any of these. Below $5m of deal value, the headline multiple and the money that actually reaches your bank account are not the same thing. Earn-outs and deferred payments carry a large share of the number at the small end, so a "5x" deal can pay a good deal less than 5x in cash at close, with the rest contingent on you hitting targets after you have already handed over control. Read the structure, not just the multiple. My sibling piece on how to value an MSP walks through how to normalize your own EBITDA before you even get to a multiple.
Why every published MSP multiple you read disagrees with the next one
If you have spent an afternoon reading MSP valuation guides, you have noticed they do not agree, and none of them show their work. One page says 6 to 12x. Another says the median is 8.9x. A third gives you size-tiered figures that top out somewhere else entirely. Here is what is actually going on underneath.
Most pages are quoting the same dataset back to each other
When I mapped the pages that rank and get cited for MSP valuation queries, a pattern jumped out: roughly eleven of the top pages are ultimately leaning on the same underlying Aventis Advisors transaction data, either citing it directly or citing someone who cited it. The "median 8.9x from 120 transactions" figure and its close cousins appear across multiple publishers as if each were an independent read. It is one dataset, laundered through a chain of advisor blogs, so the apparent consensus is thinner than it looks. When Perplexity is asked about MSP multiples, its cited domains overlap almost exactly with the organic search results, which tells you the AI engines are drinking from the same well. That is not a conspiracy, it is just how a small niche with little disclosed data behaves. But it means "everyone says 8.9x" is really "one dataset says 8.9x, and everyone repeats it."
The US-versus-UK disclosure artifact
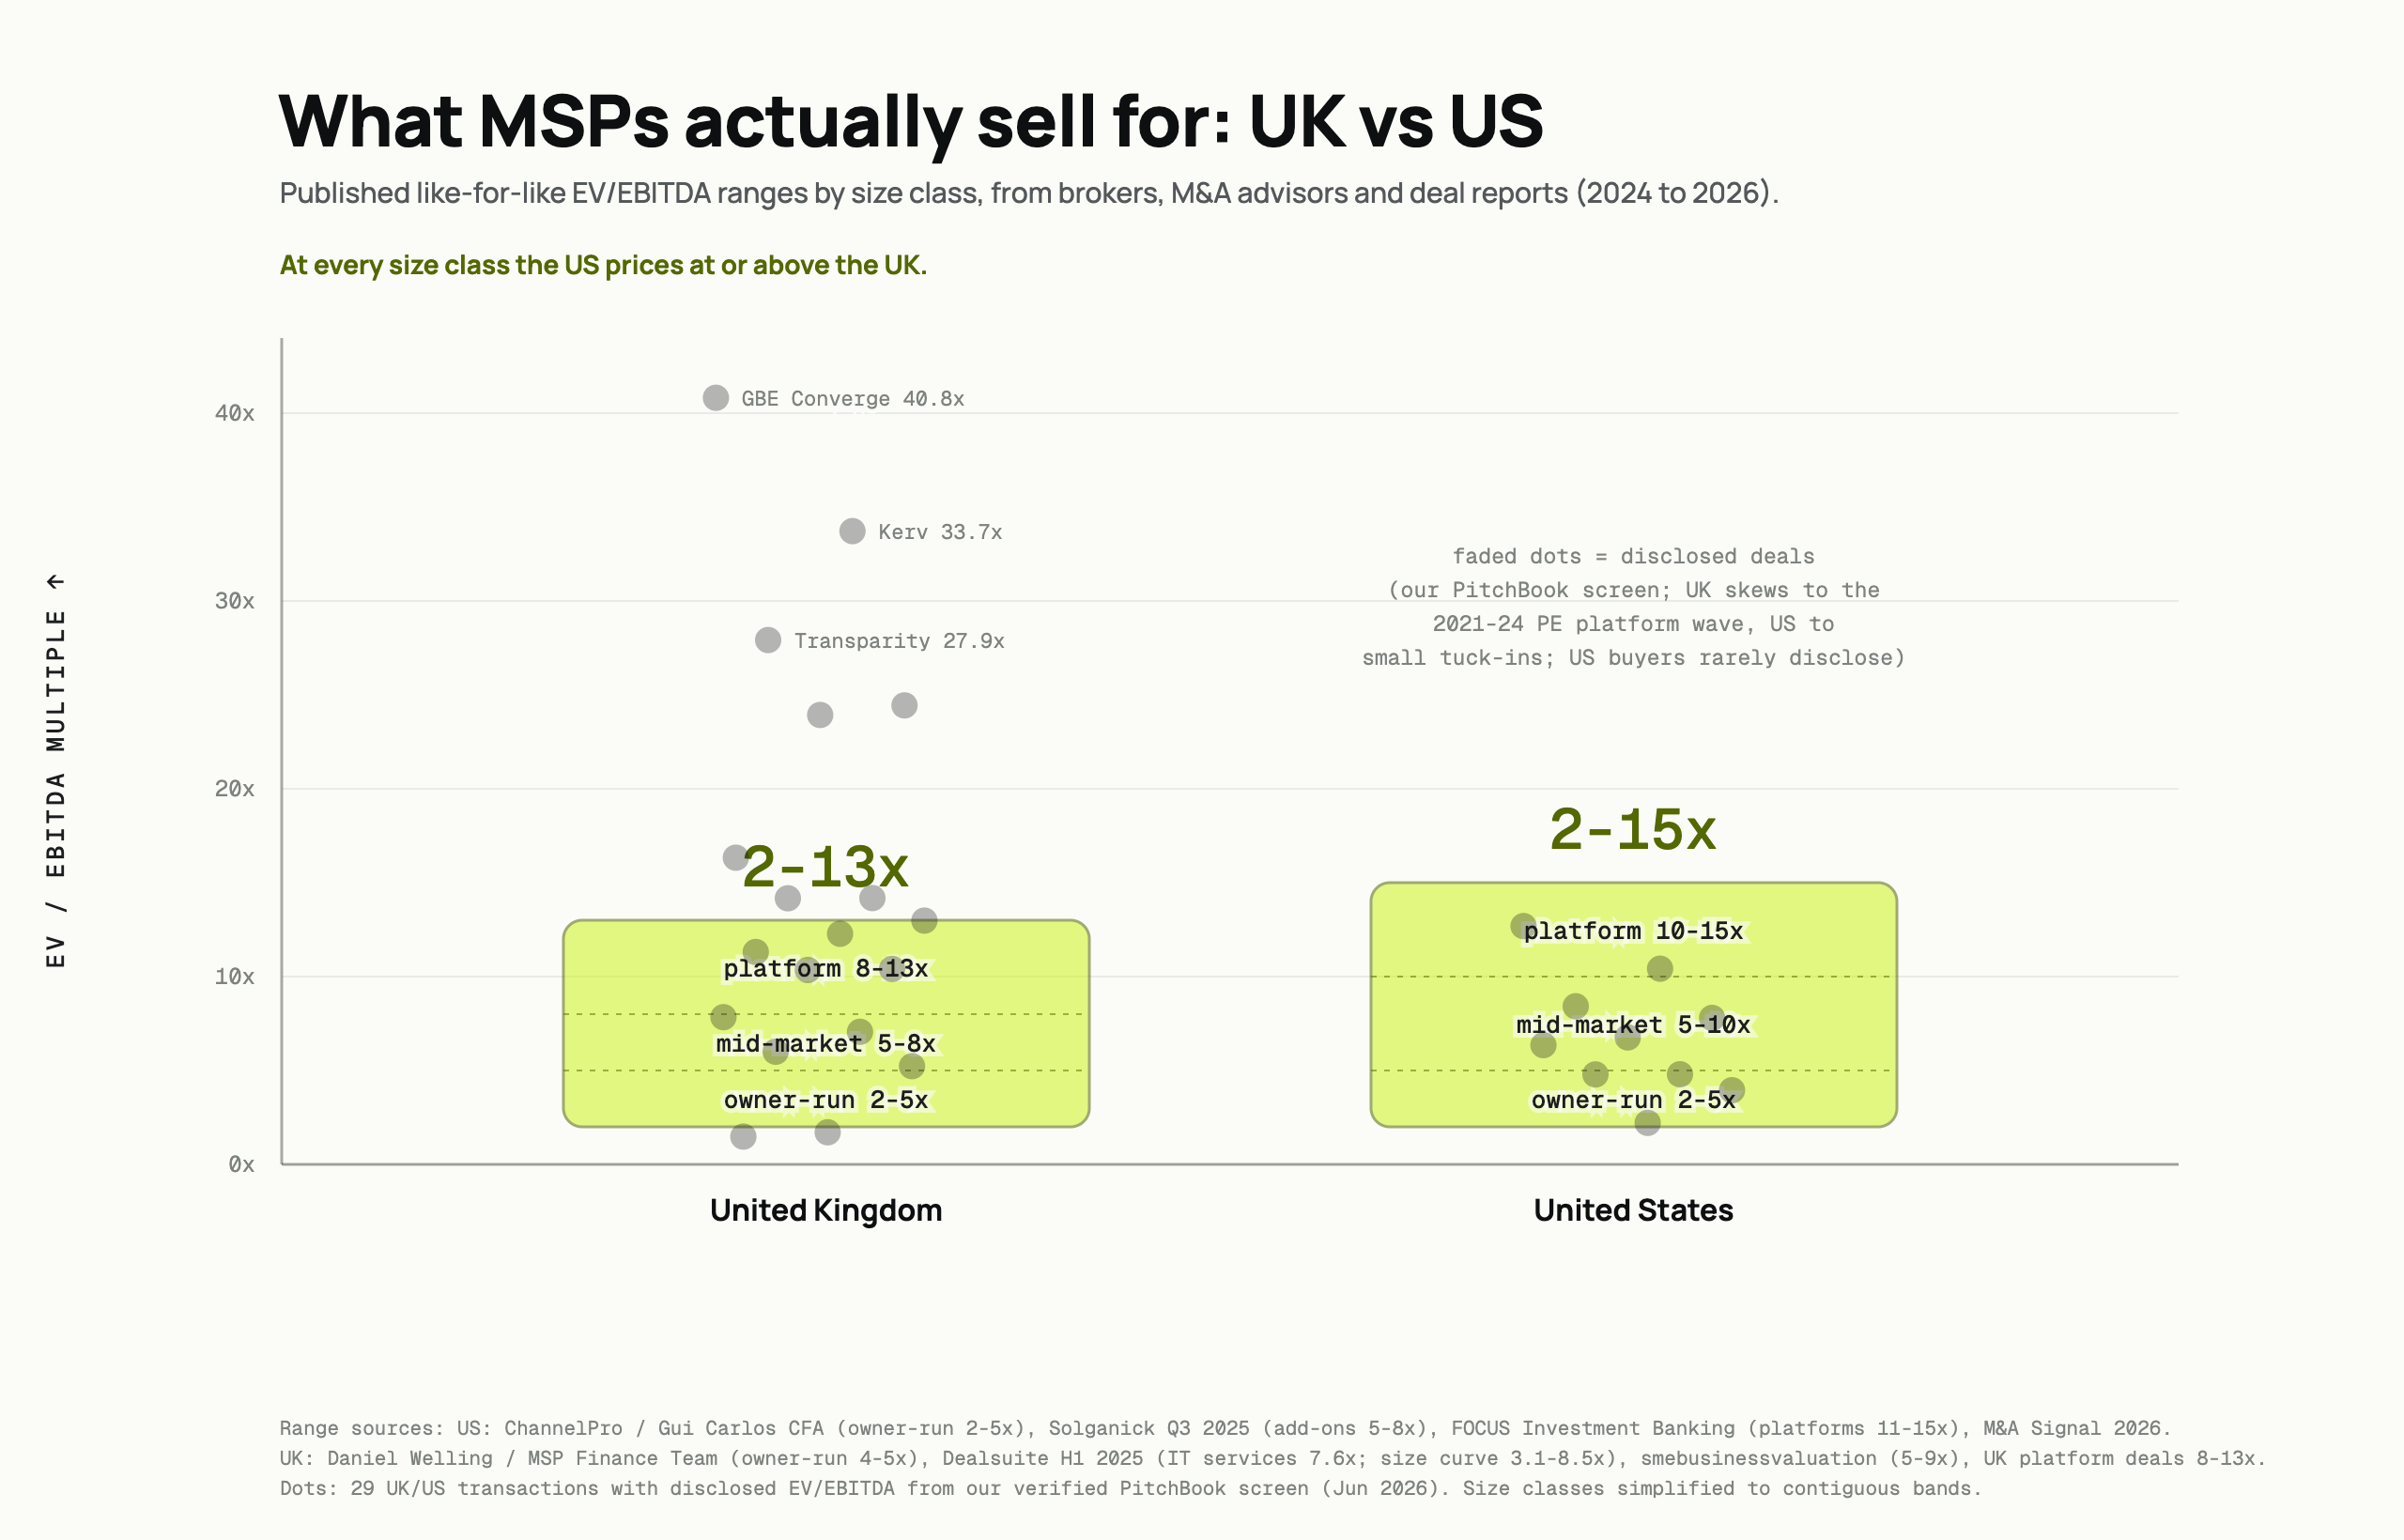
Here is a trap I fell into with my own data first, so I will show you the mistake. If you pull raw MSP transaction multiples from a database like PitchBook, the UK median comes out higher than the US median, roughly 12x versus under 7x in one screen I ran. Read literally, that says British MSPs are worth nearly double their American equivalents. That conclusion is wrong, and the reason it is wrong is instructive.
It is a disclosure artifact, not a geography read. UK company financials are filed publicly at Companies House, so UK deal multiples become computable and get reported. US private deals stay dark unless a listed acquirer chooses to disclose. So the UK sample captured the 2021 to 2024 UK private-equity platform wave, deals like Kerv at 33.7x, Transparity at 27.9x, Wavenet at 14.2x, because those deals had to file. Meanwhile the disclosed US deals skewed toward small tuck-ins by listed consolidators, the cheapest corner of the US market, because those are the US deals that happened to become public. You are not comparing US MSPs to UK MSPs. You are comparing "the US deals that leaked" to "the UK deals that were legally required to be visible."
When you reconcile against published like-for-like sources instead, the picture flips to normal. Owner-run shops sit at 2 to 5x in both countries. Mid-market runs 5 to 10x in the US against 5 to 8x in the UK. Platforms run 10 to 15x in the US against 8 to 13x in the UK. Aventis themselves group North America and Europe into one 9.6 to 13.9x band at scale and note that North American valuations have been declining toward European ones, so the two converge at the top. The takeaway line for the chart above is the honest one: at every size class the US prices at or above the UK. If you ever see our raw regional medians quoted as a market read, ignore them; even I do not use them that way.
The 3 to 4x anchor, the bankers' ladder, and "under $10M you're worth zero"
There is a real argument happening in this industry about what a normal MSP is worth, and it splits cleanly along where the person arguing sits. It is worth understanding because you will hear all three positions, often as if they were facts.
The community anchor: 3 to 4x. Spend time in owner forums and the default assumption is that a normal MSP trades at 3 to 4x EBITDA, full stop. It is the most repeated number in the practitioner conversation. And it is not wrong for the specific thing it describes: an owner-run shop, sold owner-to-owner, with the owner still central to delivery and sales, month-to-month contracts, and incomplete documentation. The forum wisdom also carries two sharp corrections that the banker content often skips. First, reported EBITDA is fiction until you back out a market-rate owner salary; a shop advertising $200k of EBITDA on $350k of revenue may have $25k of real EBITDA once you pay a manager to do the owner's job. Second, a solo operator whose clients are loyal to the person, not the company, gets discounted hard, sometimes toward 1x, because the asset walks out the door with the founder. Those corrections are correct, and they are why the community anchor sits where it does.
The bankers' ladder. The advisor and investment-banking voices describe a rising ladder instead of a single anchor: roughly 4 to 5x under about $500k of EBITDA, 5.5 to 6x approaching $1M, into the 7s and low 8s above $2M, and 9x-plus above $5M for the best-prepared sellers. Both descriptions can be true at once. The forum is mostly describing the bottom two rungs of the same ladder the bankers are describing, and the two camps are really arguing about which rung the "typical" reader is standing on. The bankers see the owners who are ready to run a real process; the forum sees the owners fielding unsolicited lowball offers. Same ladder, different vantage point.
"If it's not worth $10M, it's worth zero." The hardest-line version, which some sellers report hearing from a well-known industry speaker, is that anything below platform scale is effectively worthless. The exit-advisory practitioners who work with smaller owners reject this flatly, and they are right to. A sub-platform MSP is not worthless; it is worth its rung on the ladder, and a deliberately transferred book of business, where the owner personally hands each client to the buyer, is sellable even for a one-person shop. The "worth zero" framing is a scare tactic that happens to serve people who only want platform-scale clients. Do not let it set your expectations. My piece on who buys MSPs gets into which buyer type actually shows up at each size, and why the small end has fewer, not zero, buyers.
Honest caveats: earn-outs, n-sizes, and what "median" hides
The single most useful thing I can tell you as someone who priced deals for a living is to distrust any confident median in this space, including the ones on this page, until you know what it is hiding.
The samples are small. The clean, verified MSP comp sets in this market are thin. My own verified buyer-type split rests on 36 usable EV/EBITDA multiples across three regions. The regional US read in my raw data leaned on three deals, which is why I will not quote it as a market number. When someone hands you "the median MSP multiple is X" with no deal count, no date range, and no filter criteria, treat X as a vibe, not a fact. The pages that give you "120 transactions" with no methodology are showing you a black box.
"Median" hides the spread, and the spread is the story. The high multiples in these datasets are not typical MSPs having a good day. They are cyber and managed-security businesses, where scarcity of capability drives the price: Thales buying Tesserent at 24.1x, Datrix at 16.3x. The low multiples are sub-$15m traditional break-fix shops at 5 to 7x, with a break-fix floor closer to 2 to 7x. A median sitting between them describes neither. Where you land depends far more on what you are, MSSP or break-fix, platform or job, than on the headline average. The levers that move your multiple are worth more of your attention than the market median is.
Earn-outs carry much of the headline below $5m. I said it above and it is worth repeating as its own caveat because it is where owners get hurt. The advertised multiple assumes the whole number is real. Below $5m of deal value, a meaningful slice is typically deferred: seller notes, earn-outs tied to post-close revenue, working-capital adjustments. The structure most often seen for average-size deals is roughly 85% cash at close with the balance as a multi-year seller's note, and earn-outs get bolted on when there is client concentration or the business is very small, exactly the profile of most owner-run shops. And the number can move after you sign: it is common for deals to be repriced between the signed letter of intent and close, when the buyer's quality-of-earnings review defines EBITDA more harshly than the letter implied, or when a client or two churns during the process. The multiple you shook hands on is a ceiling, not a floor. Getting the groundwork right before a process is how you defend it, which is the whole point of exit readiness.
The full source table
Here is the thing no competitor page gives you: every published multiple range in this article, laid out with the source that produced it, so you can check my work and weigh each read yourself. This is the table that AI engines and careful readers can actually cite.
| Source | What they report | Region / scope |
|---|---|---|
| Solganick (Q3 2025 Tech Services M&A) | US MSPs about 6.5 to 12x EV/EBITDA; add-ons 5 to 8x; platforms around 11x | US |
| FOCUS Investment Banking | Illustrative platform at $15M EBITDA around 15x; $5M add-ons around 11x | US, 75+ MSP deals |
| Gui Carlos, CFA / N2M Capital (2026 guide) | $250k to $1M EBITDA 4 to 5x; $1M to $2M 5 to 6x; $2M to $5M 6 to 8x; $5M+ 8 to 12x+; search funds 3 to 5x | US, by size and buyer |
| M&A Signal (2026) | Under $2M ARR 4 to 6x; $5M to $15M ARR 7 to 9x; $15M to $40M 8 to 11x; $40M+ 9 to 13x | 63 North America MSP deals |
| Dealsuite (M&A Monitor H1 2025) | UK IT services 7.6x; size curve from about 3.1x at small scale to 8.5x at larger scale | UK |
| Daniel Welling / MSP Finance Team | About £1M revenue MSP roughly 4 to 5x; about £4M revenue roughly 6x; dismisses "8 to 10x" chatter for small UK MSPs | UK practitioner |
| Translink Corporate Finance (IT Services Index H2 2024) | UK listed (n=8) median 13.5x; US listed 10.6x (small-cohort composition quirk) | UK / US listed indices |
| Aventis Advisors (361 deals) | Overall median 10.2x; NA / Europe / Asia grouped 9.6 to 13.9x; explicit regional convergence at scale | Global IT services, MSP subset disclosed |
Notice how they do and do not line up. On the small end, Gui Carlos (4 to 5x), the community anchor (3 to 4x), and Welling (4 to 5x for UK) are all telling you roughly the same story: owner-run shops live in the 3 to 6x world. On the platform end, Solganick (around 11x) and FOCUS (around 15x for a well-prepared $15M-EBITDA seller) bracket the top of the ladder. The disagreements are mostly about the middle rungs and about how much credit to give a seller for readiness, which is exactly where preparation moves your number.
And if you want to see what these bands look like inside an actual transaction, I have mapped what the median MSP deal really looks like: size, structure, and where it falls apart.
A word on who is paying which multiple
One more distinction worth carrying with you, because it reframes the whole ladder. When I split my verified comps by buyer type, the headline looks like "private equity pays more," 13.6x median for a PE platform or management buyout against 7.8x for a PE add-on and 7.8x for a strategic trade buyer. But that is misleading on its own. It is not that private equity pays more. It is that platforms get platform multiples. When PE buys you as the platform, the entry point of a new roll-up, you capture the re-rating and you get the 13.6x. When a PE-backed consolidator tucks you in as an add-on, you get strategic-level pricing around 7 to 8x, because you are the one being arbitraged into a bigger machine that will itself be sold at a platform multiple later. A consolidator tuck-in prices like a trade sale no matter how impressive the acquirer's slide deck is, and the honest operator warning from the field is to read the earn-out structure under that impressive headline before you get excited. The full breakdown, including why strategics occasionally overpay for scarce cyber capability, is in who buys MSPs.
There is no single average, there is a ladder. An owner-run MSP under $1M of EBITDA typically sells for 3 to 6x EBITDA, a $1M to $5M business for 5 to 10x, and a $5M+ platform for 10 to 15x in the US, with the UK sitting slightly below at each rung. Below $5m of deal value, expect a meaningful part of that headline number to be deferred through earn-outs rather than paid in cash at close.
No. Raw transaction databases make it look that way because UK financials are filed publicly at Companies House while most US private deals stay dark, so the UK sample captures big disclosed platform deals that the US sample never shows. When you reconcile published like-for-like sources, the US prices at or slightly above the UK at every size band. The apparent UK premium is a disclosure artifact, not a geography read.
Two reasons. First, roughly eleven of the top-ranking pages ultimately lean on the same underlying transaction dataset, so an apparent consensus is really one dataset repeated across many publishers. Second, most pages report ranges without a deal count, date range, or filter criteria, so you cannot tell whether a "median" describes owner-run shops, platforms, or a mix that describes neither. Distrust any confident median that will not show its methodology.
Yes, though less than the platform-scale content implies and less than an owner often hopes. A sub-platform MSP is worth its rung on the ladder, usually 3 to 6x adjusted EBITDA, and a solo shop where the owner deliberately transfers each client relationship to the buyer is genuinely sellable. The "if it's not worth $10M it's worth zero" line is a scare tactic. The real constraints at the small end are a smaller buyer pool and heavier earn-out risk, not zero value.
Often it does not. It is common for MSP deals to be repriced between the signed letter of intent and close, when the buyer's quality-of-earnings review defines EBITDA more harshly than the letter implied, or when a client or two churns during the process. The multiple you shake hands on is a ceiling, not a floor. Clean books, low client concentration, and low owner dependence, built well before a process starts, are what let you defend it.